The "Bridge" Narrative: Walking the Board Through the Miss
When presenting a $100K+ forecast miss to a board of directors or PE operating partners, the goal is to move quickly from "what happened" to "what is next." A board-defensible forecast package should already contain the evidence to support this narrative — the bridge is the board-facing expression of the controls the company operates week to week. A professional variance bridge narrative anchors the room in the original commitment and then walks through the deltas:
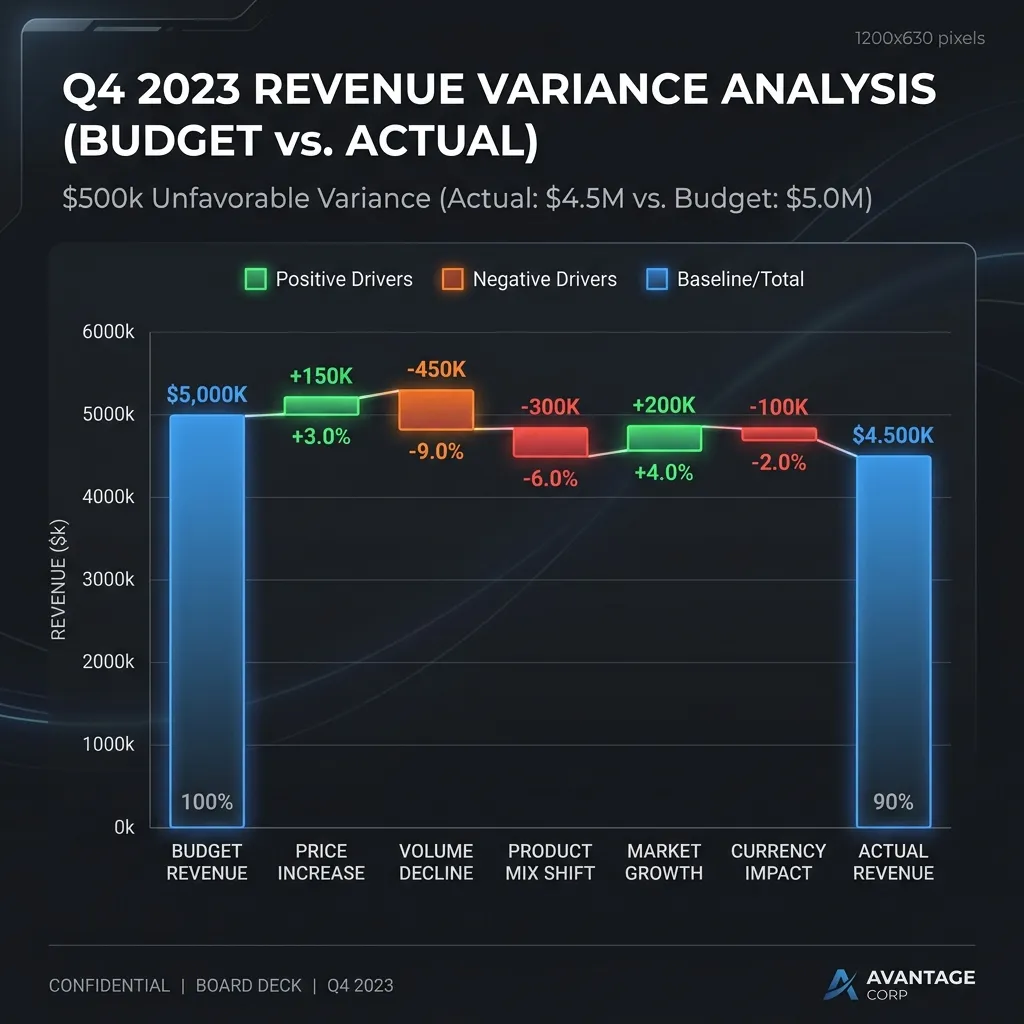
- The Re-Anchor: "We committed $500K; we delivered $380K. This 24% shortfall is outside our target band."
- The Drivers: Break the $120K gap into 3-5 mutually exclusive drivers (e.g., Win Rate -10%, Timing/Slips -15%, Expansion Drag -5%).
- The Segment Detail: Is the miss localized to Enterprise New Logos or a specific geography?
The "Three Whys" Root Cause Analysis
Board members care most about whether the team can prevent recurrence. Use the Three Whys framework to audit the revenue system:
- Why did it happen (Outcome)? "We missed because enterprise win rates dropped from 31% to 24%."
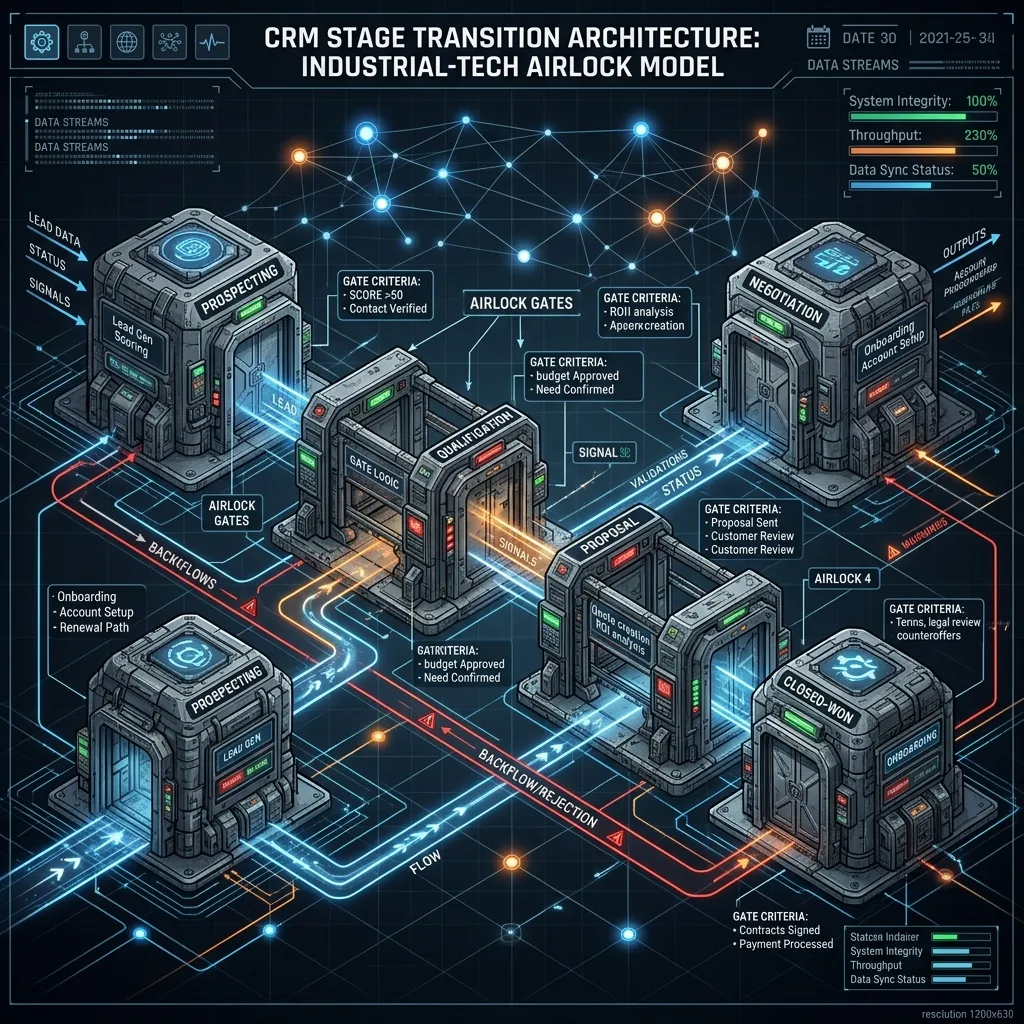
- Why did the system allow it (Control Failure)? "We lacked strict stage-exit criteria. Deals sat in late-stage without validated budget or economic buyer confirmation."
- Why won't it recur (Remediation)? "We have implemented a weekly forecast governance call by segment with mandatory MEDDIC verification for any deal in the 'Commit' category."
Timing vs. Structural Variances
To preserve credibility, the CFO and CRO must explicitly split the miss into two categories:
- Timing Variance (Slippage): Revenue that moved out of the quarter but remains in the pipeline with buyer-verified milestones. This is a scheduling issue.
- Structural Variance (Loss): Revenue lost to competition or a market shift. This is a strategy issue that requires a revised full-year outlook.
Labeling everything as "timing" is a red flag for boards. Acknowledging structural issues and presenting a plan to replace that pipeline is the only way to maintain investor trust. Boards that understand what good forecast variance looks like by stage will apply that context immediately — which is why the explanation needs to be ready before the meeting.
Free Model
What is your forecast variance actually costing you?
Run the numbers: model your quarterly revenue at risk, the cost of inaction, and how fast the fix pays back, with stage-specific benchmarks for Series A–C.
Run the ROI Model →