The Difference Between "Good" and "Elite" Predictability
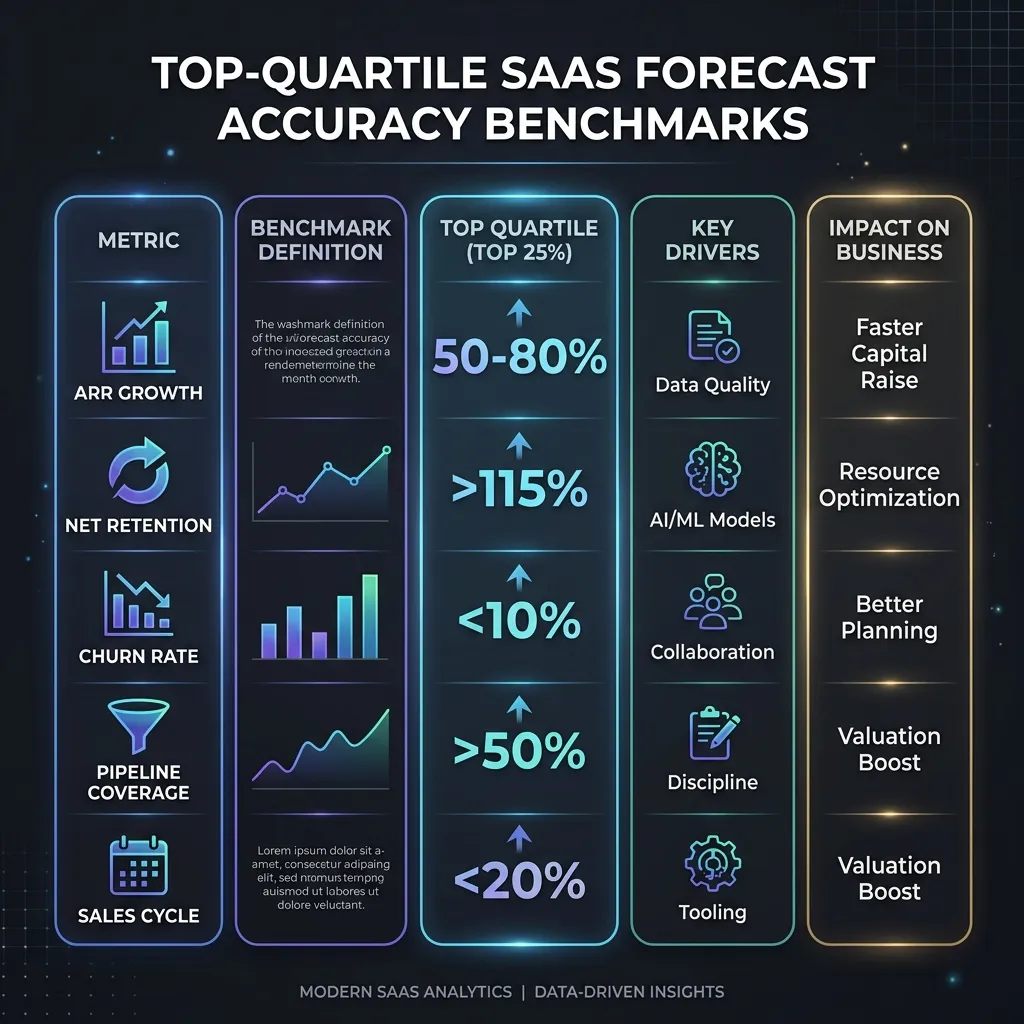
In a $5M to $50M ARR B2B SaaS organization, the sales forecast is not just a target; it is a measure of operational maturity. While manual roll-ups often suffer from ±25% variance, top-quartile organizations achieve single-digit accuracy. Series A companies typically carry wider error bands than Series B because stage discipline and process infrastructure are still being built. Research benchmarks from 2024-2025 identify clear bands of performance:
- Elite (Sub-5%): Public-company-ready discipline. These organizations command premium valuation multiples because their revenue engine is highly predictable.
- Good (5-10%): The standard for healthy, well-governed Series B and C organizations.
- High-Risk (>15%): Persistent misses at this level signal failures in pipeline qualification, CRM hygiene, or management oversight.
Research Benchmark: According to 2024 revenue operations data, elite SaaS companies hit within 5% of their quarterly forecasts 95% of the time.
The Direct ROI of Forecast Accuracy
Reducing forecast variance is not just a reporting win; it has a direct impact on the P&L and enterprise value. For a $20M ARR organization, moving from 15% to 5% variance typically yields:
- Operating Efficiency: A 15-point improvement in accuracy historically correlates with a ~3% pre-tax profit margin increase. At $20M ARR, this is worth approximately $600,000 in recoverable profit.
- Burn Multiple Protection: Accurate forecasts prevent the "Capital Waste" of hiring 6-12 months ahead of ghost revenue. Improving accuracy allows for surgical capital allocation instead of defensive over-hiring.
- Valuation Premium: Private equity and late-stage VC firms often trade predictability for higher multiples. Organizations with ≤5% variance can see valuation multiples 10-30% higher than peers with volatile ±20% performance.
Free Model
What is your forecast variance actually costing you?
Run the numbers: model your quarterly revenue at risk, the cost of inaction, and how fast the fix pays back, with stage-specific benchmarks for Series A–C.
Run the ROI Model →PLG vs. Enterprise: Differentiating the Motion
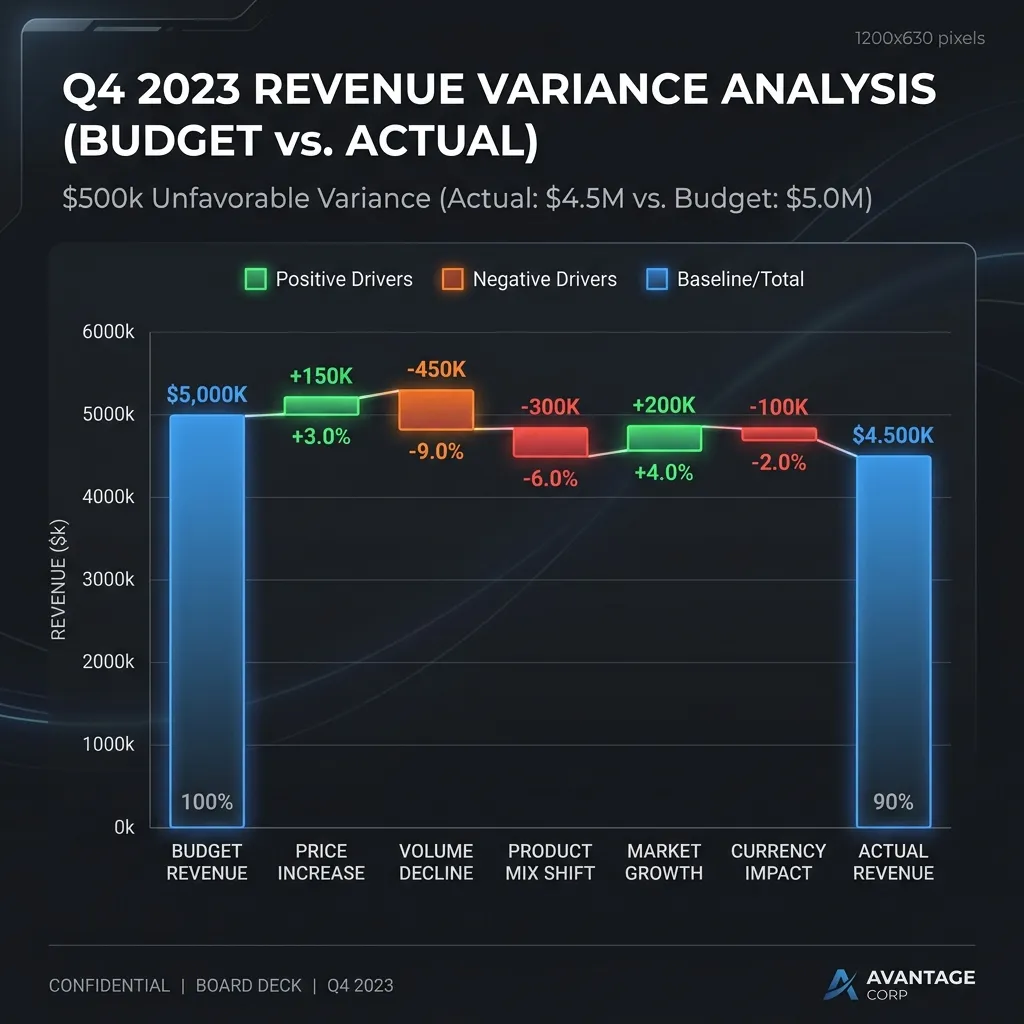
Accuracy expectations change based on the go-to-market motion. High-velocity PLG (Product-Led Growth) models rely on statistical cohort data and usage analytics. Enterprise Field Sales rely on deal-level milestone verification (e.g., MEDDIC). When presenting accuracy data in this context, the variance bridge framework helps boards understand which motion drove the miss — and why the correction path differs by segment.
In PLG motions, monthly recurring revenue (MRR) typically sees tighter bands (3-7% MAPE) because of the sheer volume of data points. Enterprise motions are "lumpier"; a single slipped six-figure deal can move the quarter by 5%. However, boards still expect a unified company-level variance of ≤10% by applying different forecasting methodologies to each segment.