Forecast Accuracy Starts With a Definition, Not a Dashboard
Most teams talk about forecast accuracy as if everyone means the same thing. They do not. One leader means quarterly bookings versus target. Another means ARR added versus plan. Another means whether the commit number was within a tolerance band. If the metric basis changes by meeting, the company does not have a forecasting problem yet. It has a definition problem.
That is why the first step is to define the number before you benchmark the number. Research benchmarks for Series A-B SaaS commonly place forecast error somewhere in the mid-teens to low-thirties depending on stage, motion complexity, and metric basis. Useful context, but only after the company states what it is actually measuring.
Define the Metric Before You Use the Benchmark
If you are going to quote MAPE or forecast error in a board or operator discussion, define the basis locally.
- Period: monthly, quarterly, or annual forecast window.
- Revenue basis: new business bookings, total ARR movement, billed revenue, or collected cash.
- Error method: absolute percentage error, signed variance, or tolerance to plan.
- Submission point: what forecast date you are comparing to the final result.
Without that definition box, a benchmark like "Series A companies miss by 20-30%" sounds rigorous while remaining only partly comparable. It may still be directionally useful, but it is not a management control yet.
What Research Benchmarks Actually Tell You
Research benchmark: early-stage SaaS forecasts are usually less stable than leadership teams want to admit. Series A companies commonly operate with larger error bands than Series B companies because deal counts are lower, pricing is still moving, and process discipline is not yet fully installed. The pattern matters more than the exact number: the market expects young SaaS companies to miss more often than later-stage operators.
That should reduce false shame, not lower the bar. "Average" is not the same as "acceptable." If the board is making hiring, spend, or financing decisions from the number, leadership still needs to explain where the miss comes from and what control will reduce it next quarter.
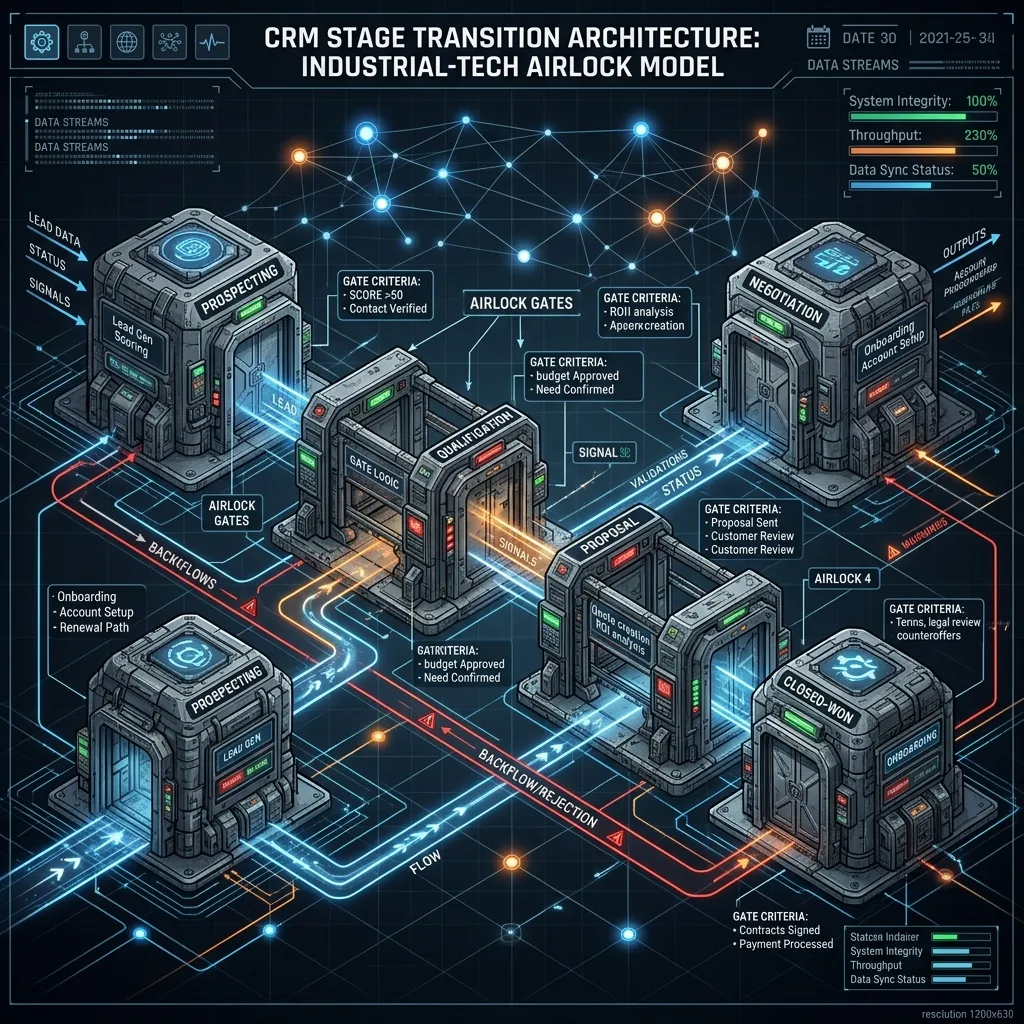
The Four Breakpoints Behind Most Forecast Misses
Most forecast misses are not mysterious. They tend to cluster around the same operating failures.
- CRM hygiene is weak. Close dates drift, inactive deals stay open, amounts are not updated, and coverage metrics become inflated.
- Stage movement is subjective. Deals progress because the rep feels momentum, not because observable evidence exists. Stage-exit controls replace that subjectivity with binary proof artifacts.
- Renewal and timing risk enter too late. New business gets reviewed weekly while renewals, billing starts, and collections timing arrive later as "surprises."
- Version control is poor. The company cannot show how the number moved between submissions or why it moved.
Those are control failures, not software failures. A forecasting platform can amplify a governed process, but it cannot create one from scratch.
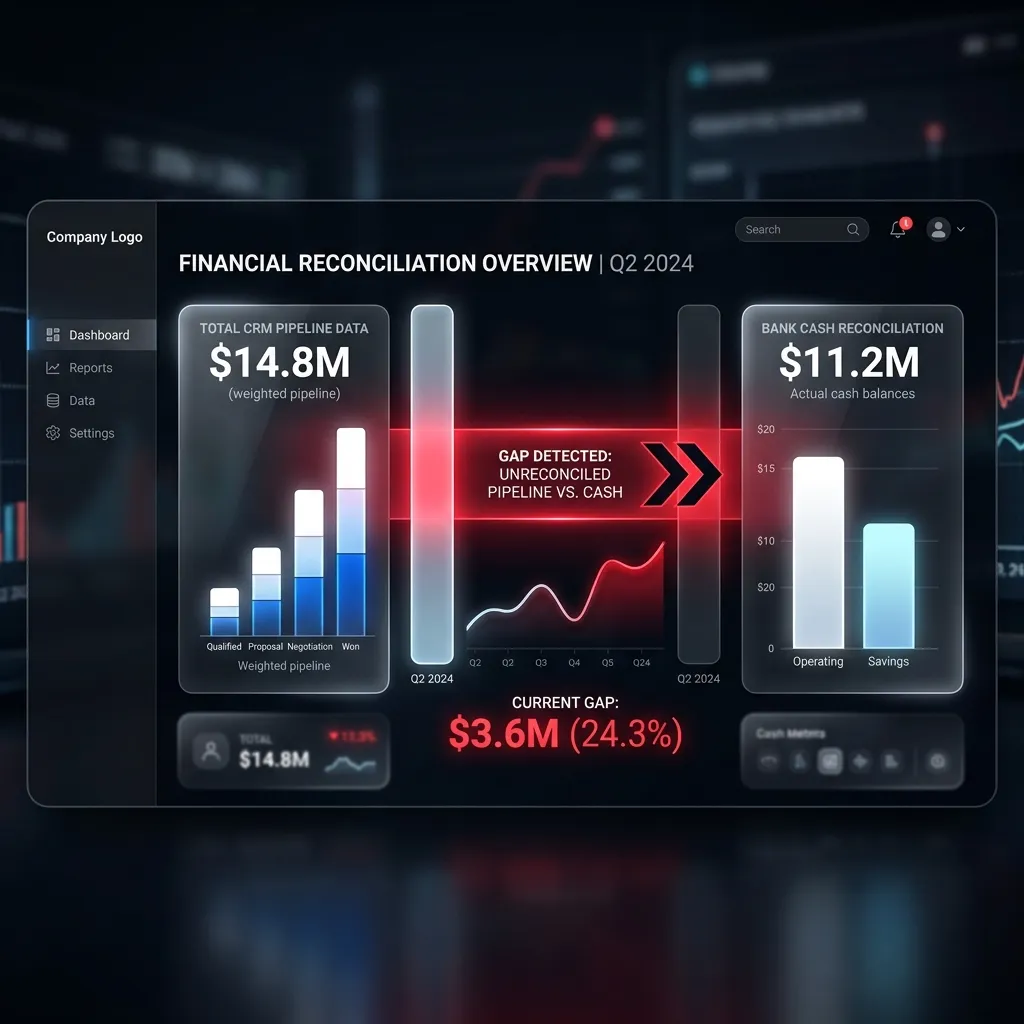
Where the Economic Cost Actually Sits
Forecast error is expensive because it changes real operating decisions. The company hires too early or too late. Marketing spend gets released against pipeline that is less real than it looks. Board trust gets consumed on explaining variance instead of discussing strategy.
Illustrative example: if a $10M ARR company carries 20-25% unsupported variance in the quarter, the planning gap is hundreds of thousands of dollars, not a rounding issue. Whether that gap shows up as missed new business, delayed billing, weaker renewals, or lower cash conversion, management is still resourcing against a number that turned out to be softer than presented.
Research benchmark: external studies often link material accuracy improvement to better resource allocation and profit performance. The exact ROI varies by company and should not be published as a guarantee. The operational lesson is simpler: a tighter forecast creates better timing decisions and fewer reactive corrections.
Free Model
What is your forecast variance actually costing you?
Run the numbers: model your quarterly revenue at risk, the cost of inaction, and how fast the fix pays back, with stage-specific benchmarks for Series A–C.
Run the ROI Model →What Better Looks Like in Practice
The immediate goal is not perfect prediction. It is reducing unsupported variance and making the remaining judgment explicit. In practice, that usually means:
- Hygiene rules: close-date discipline, active-stage standards, and deal aging reviews.
- Stage-exit evidence: clear observable proof for each meaningful stage.
- Forecast version history: visible changes between submissions, with cause codes.
- Renewal and timing visibility: retained base, at-risk renewals, billing lag, and collection exposure reviewed alongside pipeline.
That sequence matters because it turns the forecast from a persuasion exercise into an operating system. The number may still move. What changes is that leadership can explain why it moved without improvising in the room.
A Realistic Improvement Path
Illustrative example: a company starting with high-teens or mid-twenties forecast error should not set the next target as "sub-5% immediately." A more credible path is to define the metric basis in Quarter 1, install review controls and exception tracking in Quarter 2, and then measure whether the miss band narrows with each cycle.
- Quarter 1: define the metric, establish baseline error, and clean the active pipeline.
- Quarter 2: enforce stage evidence, review renewals and timing risk separately, and compare submissions week to week.
- Quarter 3: confirm whether unsupported variance has narrowed enough to change board confidence and planning behavior.
The point is not that every company will arrive at the same error band. The point is that the path becomes measurable once the control environment is explicit.
Why This Matters to the Scorecard
MxM Revenue Engineering does not treat forecast accuracy as one isolated KPI. The Scorecard inspects the systems behind the number: stage discipline, renewal visibility, billing timing, reconciliation logic, and version control. Controls Install then moves those checks into the operating cadence. Governance keeps the definitions stable so the board package stops changing its logic every quarter.
A board-defensible forecast is not the one with the most confidence in the room. It is the one with the clearest definition, the cleanest evidence trail, and the fewest unexplained movements between what the company said would happen and what actually happened.