Sales Forecast Accuracy Benchmarks (Quick Answer)
What is a good sales forecast accuracy? In B2B, most teams operate at ±15-25%, while high-performing teams achieve ±5-10%. This guide breaks down real benchmark ranges, what drives variance, and how to reach board-grade forecast reliability.
Updated: April 2026 with latest B2B benchmark ranges.
Most B2B forecasts are wrong by design, not execution.
| Category | Forecast Accuracy Range |
|---|---|
| Elite | ±5 to 10% |
| Good | ±10 to 15% |
| Average | ±15 to 25% |
| Poor | Above ±25% |
Forecast accuracy is not a reporting metric. It is a proxy for pipeline integrity, deal hygiene, and revenue predictability. Teams operating above ±25% variance are not running a forecast. They are running a guess with a number attached.
What is sales forecast accuracy
Sales forecast accuracy is the percentage by which a committed forecast lands within a defined tolerance of actual results for a given period. It answers one question: when the team submits a number, how close does that number turn out to be?
The metric matters most at three moments. Before a board cycle, when a financing round is approaching, and during investor due diligence. At each of those moments, the forecast is not just a planning input. It is evidence of whether leadership controls the business or is regularly being surprised by it.
Before quoting any accuracy figure, three definitions must be in place:
- Period: monthly, quarterly, or annual forecast window.
- Revenue basis: new ARR bookings, total ARR movement, billed revenue, or cash collected.
- Submission point: which forecast version is being compared to the final result, and at what date.
Without those three anchors, accuracy figures across companies, stages, or quarters are not comparable. A company measuring new bookings accuracy will show a different number than one measuring total billed revenue accuracy. Both can be valid. Neither can be benchmarked against the other.
The formula: how to calculate sales forecast accuracy
The standard formula for a single period is:
Accuracy% = 100 − |((Forecast − Actual) ÷ Actual) × 100|
Example: the team forecasts $1.2M and delivers $1.05M.
- Error = |((1,200,000 − 1,050,000) ÷ 1,050,000) × 100| = 14.3%
- Accuracy = 100 − 14.3% = 85.7%
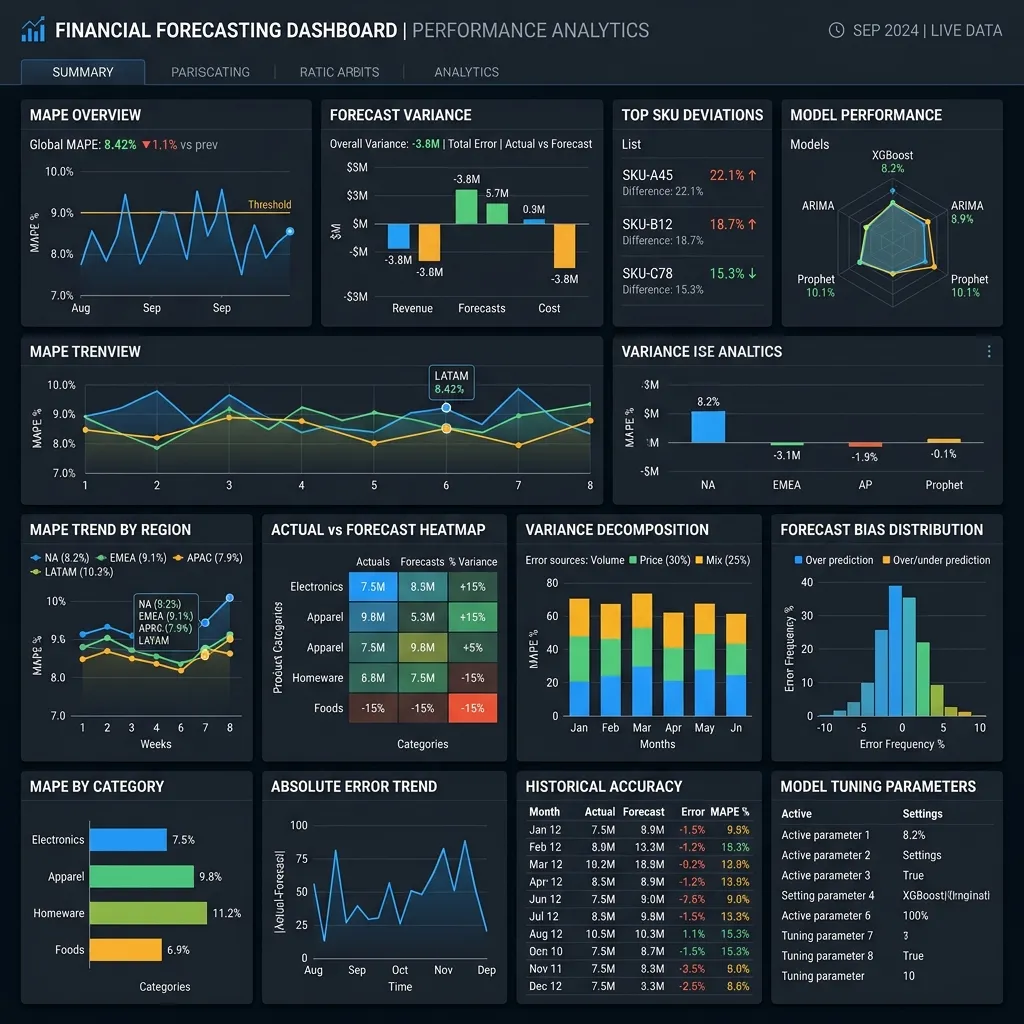
For tracking accuracy across multiple periods, the standard method is MAPE: Mean Absolute Percentage Error. MAPE averages the absolute error percentage across each period in the measurement window.
For B2B SaaS, WMAPE (Weighted Mean Absolute Percentage Error) is the more defensible metric. It weights each period's error by the actual revenue volume for that period, so a large miss in a high-revenue quarter carries more weight than a small miss in a low one. That weighting matches how boards and investors actually assess forecast risk.
WMAPE = (Sum of |Actual − Forecast| across periods) ÷ (Sum of Actuals) × 100
Accuracy from WMAPE = 100 − WMAPE. A WMAPE of 12% means 88% accuracy on a revenue-weighted basis.
When presenting accuracy to a board or investor, state which method you used, what period it covers, and whether it is based on new bookings, total ARR, or billed revenue. The number means nothing without that context box.
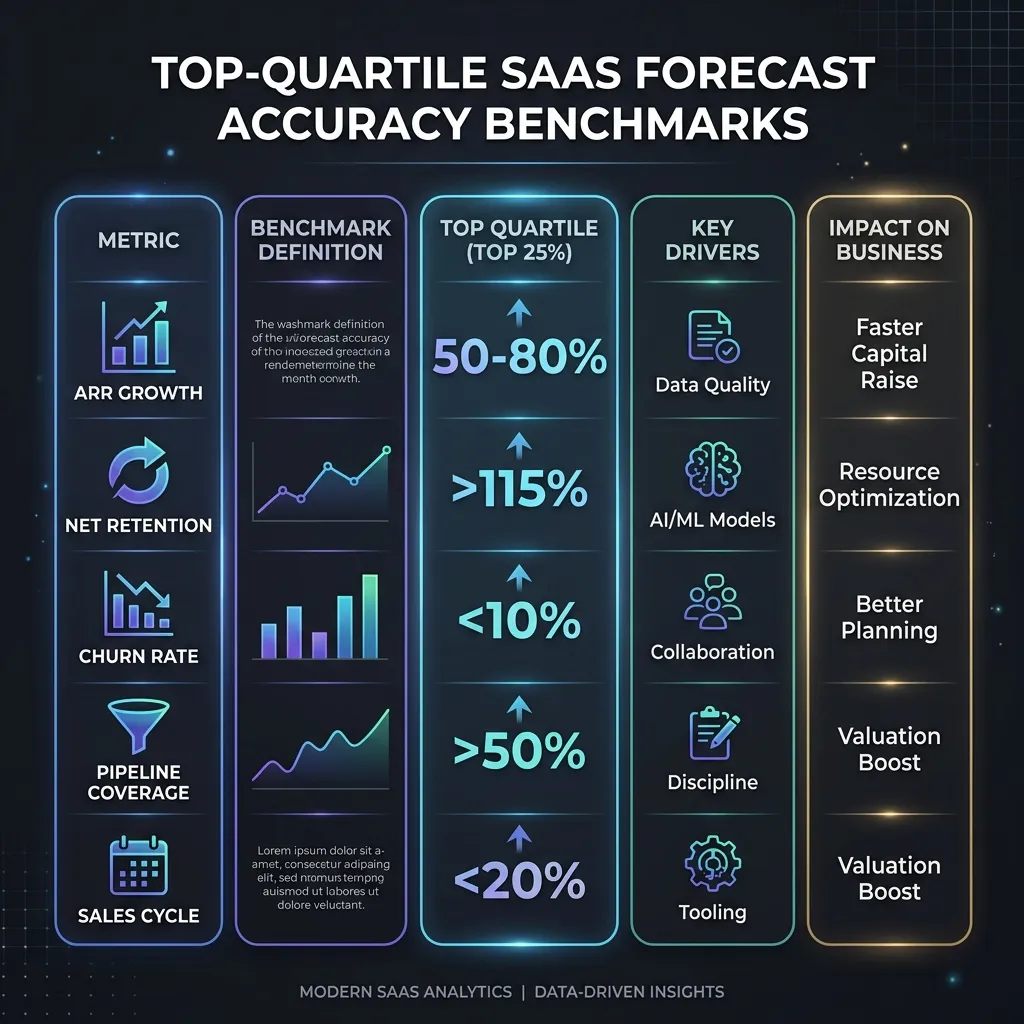
What counts as a good sales forecast accuracy benchmark
Research benchmark: the gap between where most B2B SaaS companies operate and where they need to be is wider than most leadership teams realize.
According to Gartner, only 45% of sales leaders have high confidence in their organization's forecast accuracy. SiriusDecisions and Forrester report that 79% of sales organizations miss their forecast by more than 10%, with only 21% landing within a ±10% tolerance. The Optifai B2B SaaS Pipeline Benchmark (approximately 900 organizations) shows median companies operating at ±15–25% variance, with top-performing companies at ±5–10% and struggling organizations at ±30% or worse.
Stage-specific targets from the Ven.studio 2026 RevOps Benchmark provide a practical reference for growth-stage B2B SaaS. Series A and Series B companies face different improvement paths — the controls required to close the gap differ meaningfully by stage.
| Stage | Accuracy Target | Typical Real-World Band | WMAPE Target |
|---|---|---|---|
| Series A (~$5–15M ARR) | 80–85% | 70–80% | 15–20% |
| Series B (~$15–30M ARR) | 85–90% | 75–85% | 10–15% |
| Series C+ (~$30–50M ARR) | 90–95% | 80–90% | 5–10% |
The "typical real-world" column is where most companies actually sit. The "accuracy target" column is what board-defensible operations look like for the stage. The gap between the two is what the controls install is designed to close.
Aberdeen research benchmark: best-in-class organizations using structured forecasting processes and technology reach approximately 103% forecast accuracy (slight over-forecasting is better than under), versus 89% for the rest. That 14-point gap translates directly into better resource allocation, fewer reactive corrections, and more credible board packages.
While public benchmark data varies by source and methodology, aggregated industry analysis consistently places typical B2B forecast accuracy between ±10% and ±25%, depending on process maturity and data quality. Top-quartile organizations with structured processes and defined stage criteria reach the ±5 to 10% band. That is not a technology gap. It is a process gap.
Sales Forecast Accuracy Benchmarks by Method
Forecast accuracy ranges vary significantly by the method used to generate the forecast. Observed ranges across B2B SaaS benchmarks; actual results vary by data quality and process maturity.
| Method | Typical Accuracy |
|---|---|
| Rep Commit | ±20 to 40% |
| Weighted Pipeline | ±15 to 25% |
| Historical Models | ±10 to 20% |
| AI / Statistical | ±5 to 15% |
Rep commit is the least accurate method at scale. AI and statistical models require clean historical data to reach the top band. Most $5 to $30M ARR teams are best served by a weighted pipeline model with formal stage exit criteria before upgrading to statistical overlays.
Sales Forecast Accuracy Benchmarks by Forecast Horizon
Observed ranges across B2B SaaS benchmarks. The quarterly number is what boards and investors evaluate, which is why it requires the most structural support.
| Forecast Horizon | Typical Accuracy |
|---|---|
| Weekly | ±5 to 10% |
| Monthly | ±10 to 20% |
| Quarterly | ±15 to 30% |
Shorter horizons are more accurate by design. A company that can forecast weekly at ±8% but quarterly at ±28% has a compounding problem: the individual deals are visible, but the period aggregate is not controlled.
Why most B2B SaaS companies miss their forecast
Forecast misses are not usually caused by bad market conditions or hard-to-predict buyers. They cluster around three operating failures, ranked by how often they appear as the primary issue.
1. Rep subjectivity (47% of companies cite this as their top issue)
Research benchmark from CSO Insights and People.ai: overconfidence and lack of objective evidence are the most commonly cited barriers to forecast accuracy, flagged by 47% of organizations. Reps advance deals on optimism, not on verifiable buyer evidence. Commits reflect what the rep believes will happen, not what the data supports. Sandbagging, late-quarter hockey sticks, and "happy ears" on early-stage conversations all flow from the same source: the forecast reflects rep psychology rather than deal state.
This is not a character problem. It is a process problem. Without clear stage exit criteria that require observable proof, the incentive is always to advance deals that feel likely rather than deals that are ready.
2. CRM data gaps (76% of CRM records are incomplete)
Research benchmark from Gartner and Landbase: approximately 76% of CRM records are incomplete. Missing close dates, stale deal values, inactive deals left open, and inconsistent field usage all compound into a forecast built on data that does not reflect current reality. A pipeline coverage ratio calculated from dirty data is not a risk measure. It is noise with a number attached.
The CRM is not the problem. The absence of hygiene standards is. When deals advance without evidence and fields are optional rather than required, the CRM becomes a record of intention rather than a record of operating state.
3. Methodology gaps in stage design
Many B2B SaaS companies do not have a formal forecasting process. CSO Insights research identifies this in roughly 20% of organizations as the stated barrier to accuracy. But the number underestimates the actual prevalence, because methodology gaps are often invisible. Teams have a process. It just has no stage exit criteria, no probability model grounded in historical close rates, and no definition of what "commit" actually means. The forecast runs on labels without logic behind them.
When stages do not require evidence for advancement, every number from proposal onward is an estimate with no anchor. When "commit" means different things to different reps, the manager's roll-up is already unreliable before any adjustment is made.
The four operating failures that compound these root causes: pipeline contamination (deals with no buyer evidence staying active), stage skipping (deals jumping stages without meeting exit criteria), ghost deals (inactive opportunities counted in coverage), and no reconciliation layer (sales bookings never cross-checked against Finance collections). Each one inflates the forecast before the quarter even starts.
What your forecast variance is actually costing you
Forecast error has two cost types. The direct cost is the revenue that does not materialize as planned, forcing reactive decisions on hiring, spend, and capacity. The indirect cost is the valuation and credibility impact that compounds across quarters and funding cycles.
Real-world framing: a company forecasting $10M quarterly revenue at ±25% accuracy is operating with a ±$2.5M uncertainty band. That is not a small adjustment. It is the difference between a board that can commit to a plan and one that is managing surprises every quarter-end.
Illustrative example: a $20M ARR company operating at 20% forecast variance is running on a quarterly planning uncertainty of roughly $1M. That is not a rounding error. It is the difference between releasing a new hire, delaying a marketing campaign, or holding a board conversation that goes off-script.
On the valuation side, PE practitioner data shows that companies maintaining quarterly forecast variance within 5% command valuations approximately 50% higher than companies with variance above 20%. The mechanism is direct: investors price forecast credibility as a signal of management quality. A business that consistently delivers within tolerance is treated as a different risk profile than one that regularly explains its misses after the fact.
The board confidence cost is harder to quantify but operationally real. Research benchmark from Gartner: only 45% of sales leaders have high confidence in their own forecast. When leadership does not trust the number, it cannot commit to the board with conviction. When the board cannot trust the number, it prices in a risk discount that shows up in multiples, covenants, and decision latency.
Revenue Integrity
See how far off your forecast is
The Revenue Integrity Scorecard identifies the exact failure points in your forecast system and maps them to a prioritized fix sequence. Stage-specific benchmarks for Series A through C.
Run a Revenue Integrity Scorecard →How to improve sales forecast accuracy: the fix
There is no single intervention that moves forecast accuracy materially. The fix has three components, and they need to run in sequence.
Step 1: Install stage exit criteria
Every meaningful pipeline stage needs a defined set of observable proof artifacts that must exist before a deal advances. Not a feeling of momentum. Not a rep's read on the relationship. Specific, verifiable evidence: a signed mutual action plan, a confirmed evaluation scope, a named economic decision-maker on record, a procurement intro completed.
Stage exit criteria do two things. They remove the subjectivity that drives 47% of forecast misses. They also force the truth to surface earlier, when there is still time to act, rather than in the last two weeks of the quarter when the deal that looked like an 80% close turns out to be a stall.
Step 2: Run a weekly variance review
Research benchmark from pipeline metric studies: teams that review pipeline velocity metrics weekly achieve approximately 87% forecast accuracy versus 52% for teams that review irregularly. The weekly cadence is not about effort. It is about catching leading indicators before they become quarter-end surprises.
A useful variance review compares the current forecast to last week's forecast and asks three questions: what moved, why it moved, and whether the movement was expected. That review discipline forces version accountability into the operating cadence. It also gives the board a coherent explanation of movement rather than a post-mortem on a miss.
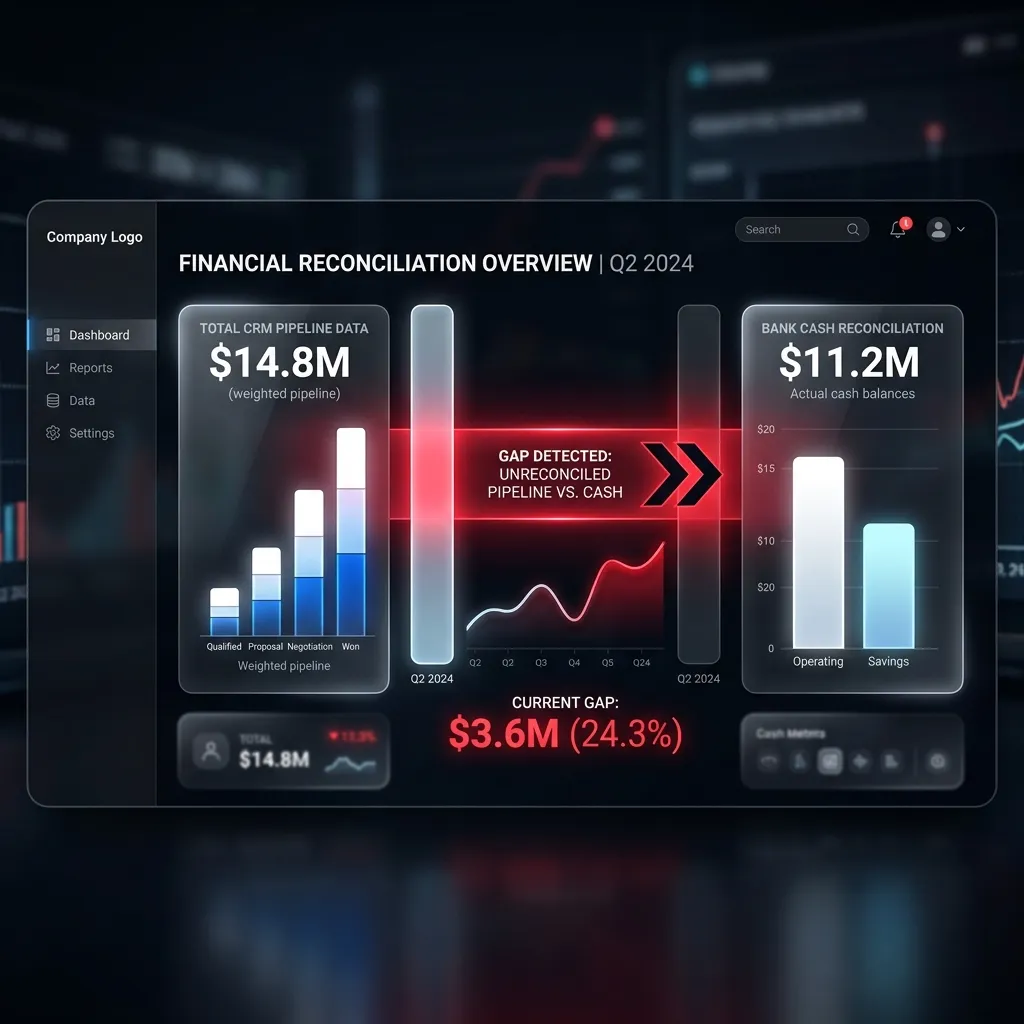
Step 3: Reconcile CRM to cash each quarter
The forecast is only as reliable as the data behind it. A CRM-to-cash reconciliation review closes the loop between what the sales team says was sold and what Finance actually collected. It compares opportunity records, contract records, invoice records, and cash receipts for the same cohort of deals.
Most reconciliation gaps come from the same sources: delayed billing starts, unsigned deals counted as won, discount drift between quote and contract, and collection timing not reflected in the forecast model. None of those are exotic problems. They are normal operating friction that becomes a forecast problem when it is not tracked.
Running that reconciliation before each board cycle gives leadership one version of the truth across sales, finance, and the bank. It removes the most common source of last-minute surprises in the board package: the gap between what CRM says and what Finance recognizes.
What this sequence produces
Companies that install all three components typically see forecast variance narrow over two to three review cycles. The Aberdeen benchmark puts best-in-class accuracy at approximately 103% with structured processes and technology in place. That is not an overnight outcome. It is the result of making the forecast a managed system rather than a roll-up of rep opinions.
The goal is not a perfect number. It is a defensible number, with a documented explanation for why it moved and a clear path to reducing the variance that remains unsupported.
Structural Fix
If your forecast variance exceeds ±15%, the issue is structural. Not tactical.
The Revenue Integrity Scorecard identifies the exact failure points in your forecast system and maps them to a prioritized fix sequence.